Analyze and visualize Hyper-V Performance using PAL
Hey, do you know PAL? Of course you know it as a color encoding system for analogue Television. But in this post I’ll introduce PAL from codeplex.
PAL (Performance Analysis of Logs) is an open source tool written by Clint Huffman (MSFT) published on Codeplex to analyze Perfmon log data and Display it in a human readable form.
Ok, you say. “Not just another another performance analysis tool please” … but..
During my Hyper-V / SCVMM Projects customers have asked me a lot, how they would be able to identify potential performance issues or debug such on their Hyper-V hosts.
Or let’s pick another one. “I feel my Hyper-V Hosts being in Performance Trouble” –> wait.. you feel? :-), ok let’s proof this feeling….
My usual answer would be “use SCOM”. So Where does PAL fit into the puzzle?
**PAL provides the following functionality
**
- Analysis of Perfmon Log binaries
- Aggregate, compare and measure the raw results against predefined threshold definitions
- Generate human readable reports in HTML Format
Report Content Examples
Requirements
PAL can be installed on any Workstation or Server and requires .NET 3.5. As the Analysis can take some minutes to hours, depending on how much data you’ve gathered with perfmon, I’d suggest not to use a production workload to run the Analysis. PAL consists basically of two components.
- PAL.ps1 (a powershell script which does the whole analysis Magic)
- PalWizard.exe (a GUI tool to configure the run Options for the Powershell script)
To generate the Graphs in the HTML Report the tool requires .NET 3.5 Chart Controls to be installed.
Usage Example
Open PAL Wizard

Change to Threshold File and choose Hyper-V 2012. You may also edit the file to match your experiences, but the defaults are ok so far.

Export the file to a local path

Now, open Performance Monitor and connect to your Hyper-V Host

Add a new User defined data set using the exported Template


Start collecting performance data (eg. 30 min or an 1h to minimize peak congestions)

Stop the data collection and copy the raw performance data file to your analysis machine. The file self is saved by default under: %SYSTEMDRIVE%\PerfLogs

Go back to PAL Wizard and define the raw data file to analyze

Fill in the answers corresponding to your Hardware where the performance data came from

For now we leave all the other options default and press execute to analyze the current data

Data is being analyzed and processes. Depending on the amount of data you collected this process can take some minutes or hours to complete.

The tool can be easily automated to analyze more than one data set serial or parallel.
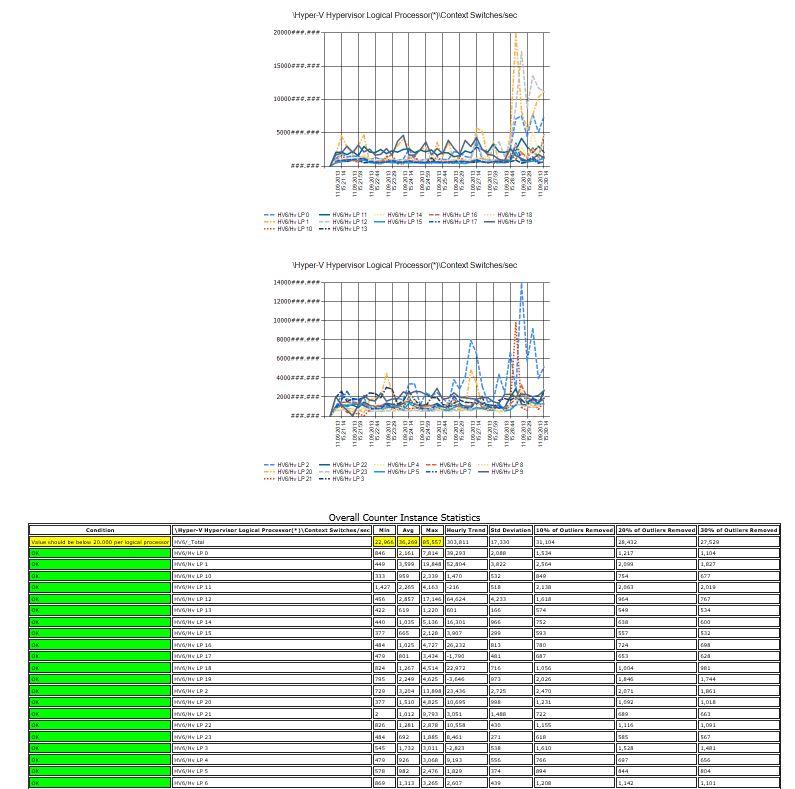
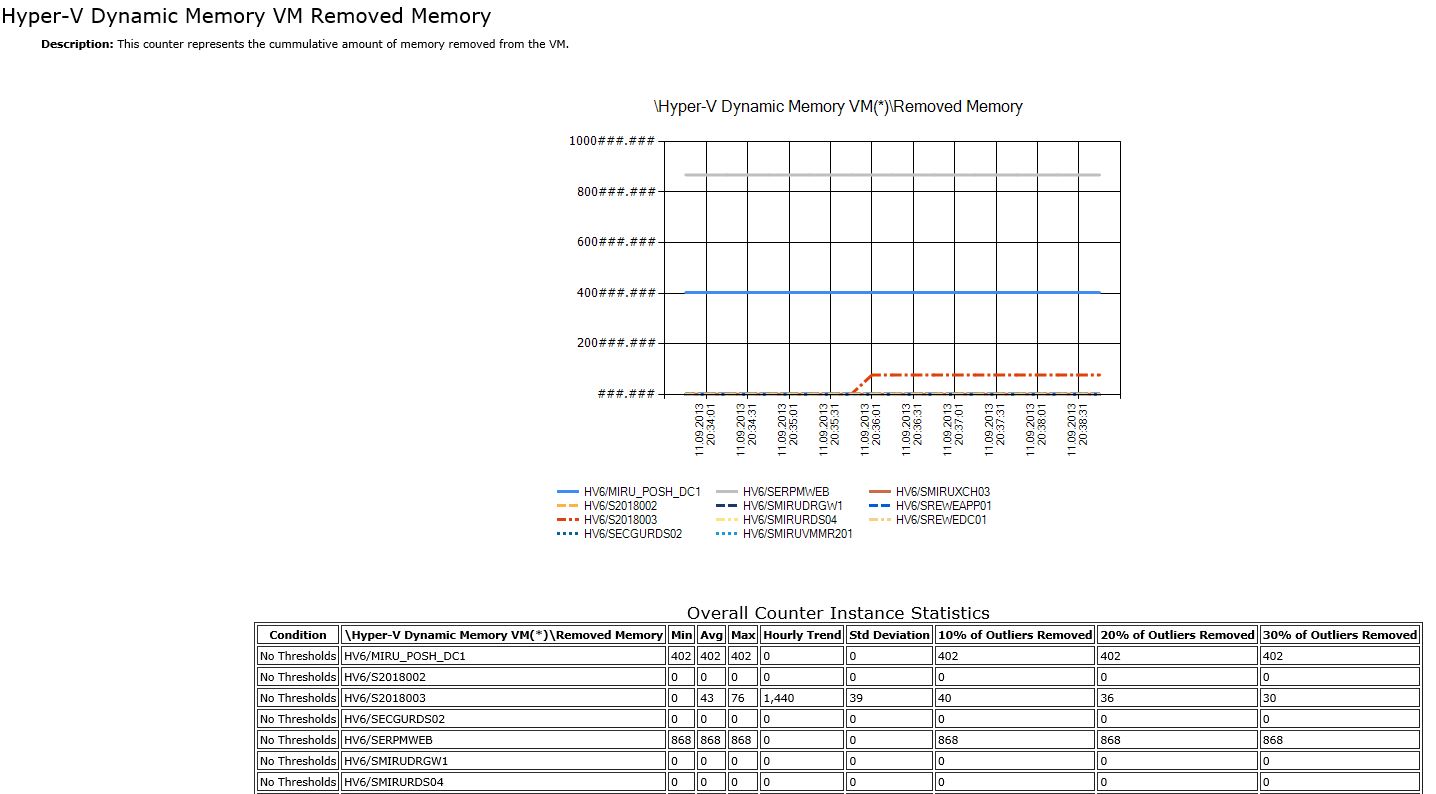
After a while you’ll get a huge HTML report with tons of useful information grouped by topics that make sense.
Some more words
As a long term solution I still prefer System Center Operations Manager, however this tool provides real value for ad-hoc analysis with a fair amount of predefined thresholds, so even people not familiar with the performance counters can get a short wrap up about the health and performance state of their Hyper-V Hosts.
I hope I could show how easily it can be to get knowledge on what your Hyper-V Hosts are doing without being a MCPMU (Microsoft certified performance monitor user)